Test Coverage Analysis
Test coverage analysis (TCA) is essential for improving product quality by striving to detect and prevent all defects on a product.
When applied to Printed Circuit Board Assembly (PCBA), TCA means checking all the manufacturing defects within the defect universe, including; missing components, wrong value, misalignment, incorrect polarity, damaged components, open circuits, short circuits, insufficient solder and excessive solder.
One test machine alone cannot catch all defects. A combination of complementary test machines is needed to achieve good coverage and each test engineer must:
- Define the optimum test strategy to maximize the test coverage
- Produce a test specification document that defines what to test
- Compare the developed tests against the test requirements

Test coverage analysis solution
Combining test and inspection equipment often leads to test redundancies across the production line, resulting in extra costs without added coverage benefits.
ASTER's solution empowers engineers to simulate test strategies using test machine models, minimizing the redundancy between strategies, optimizing test programs and ensuring maximum board coverage.
By measuring the test coverage (post debug) and comparing against the early estimate, engineers can verify if the original requirements have been realized.
- Virtual models for test and inspection machines to simulate the physical test line
- Coverage estimators to predict coverage for test and inspection machines
- Output processors to program test and inspection machines in alignment with the simulated test line
- Coverage loaders to measure the actual coverage delivered by test and inspection programs
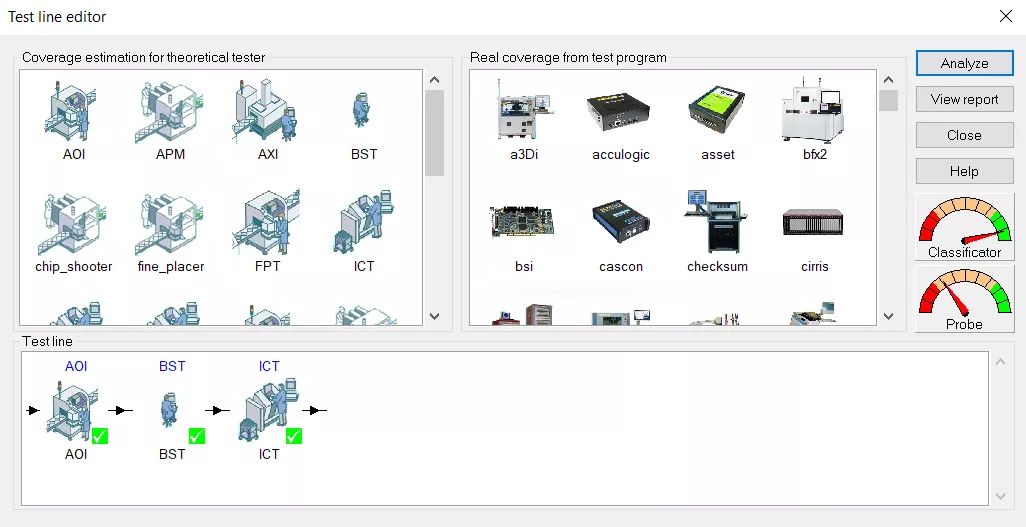
Define optimum test strategies
When deciding on the optimal test flow, it is important to consider all strategies, such as AOI, X-Ray, BST, ICT, Flying probe and Functional test.
ASTER's TCA solution enables test engineers to simulate “what-if” analysis to select the most effective combination of test equipment.
- Drag & drop test strategies into the test line using Test line editor
- Configure theoretical testers and estimate coverage for selected test strategies
- Eliminate redundant test steps, while maximize overall board coverage
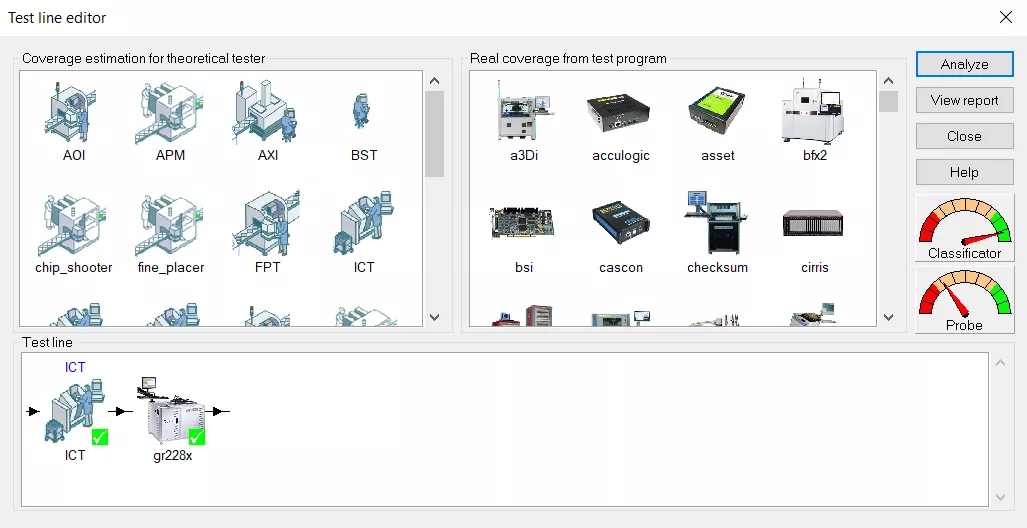
Close the loop to improve coverage
The completed post debug test program should reflect the estimated coverage defined in the simulation process.
ASTER's TCA solution allows test engineers to combine simulation results with actual test data, enabling direct comparison to verify that the completed test program conforms to initial expectations.
- Drag & drop test strategies into the test line using test line editor
- Import test programs from test & inspection machines
- Read and compare real test data vs. estimated coverage